Logs
Log viewer: view and download CDN resource logs
What is Log Viewer?
Log Viewer is a free tool designed to view and export logs of CDN resources to your device. With it, you can see and download information about requests to your resources. The service stores the logs that were recorded for the last 3 days of CDN operation.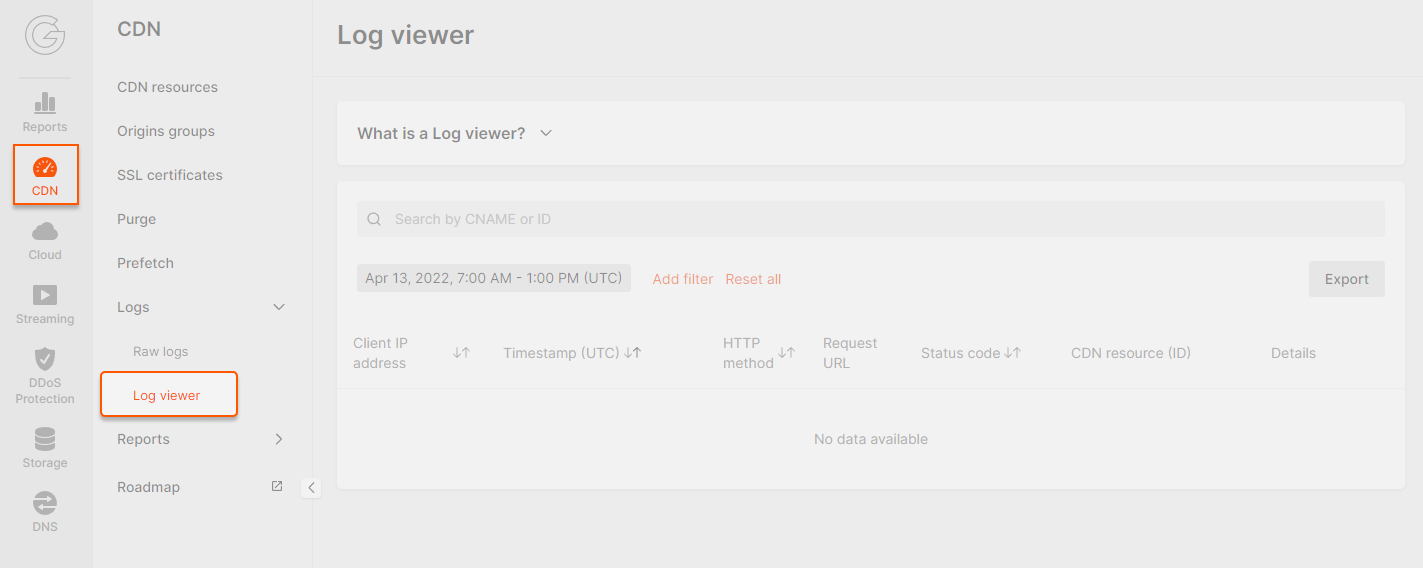
View logs in the customer portal
Log Viewer can show logs collected for a maximum of 6 hours of CDN operation. Moreover, it can only display up to 1000 log entries. If more than 1000 logs have been recorded in six hours, entries after the 1000th will not be shown. When you open the tab, you can see logs of all CDN resources for the last 6 hours.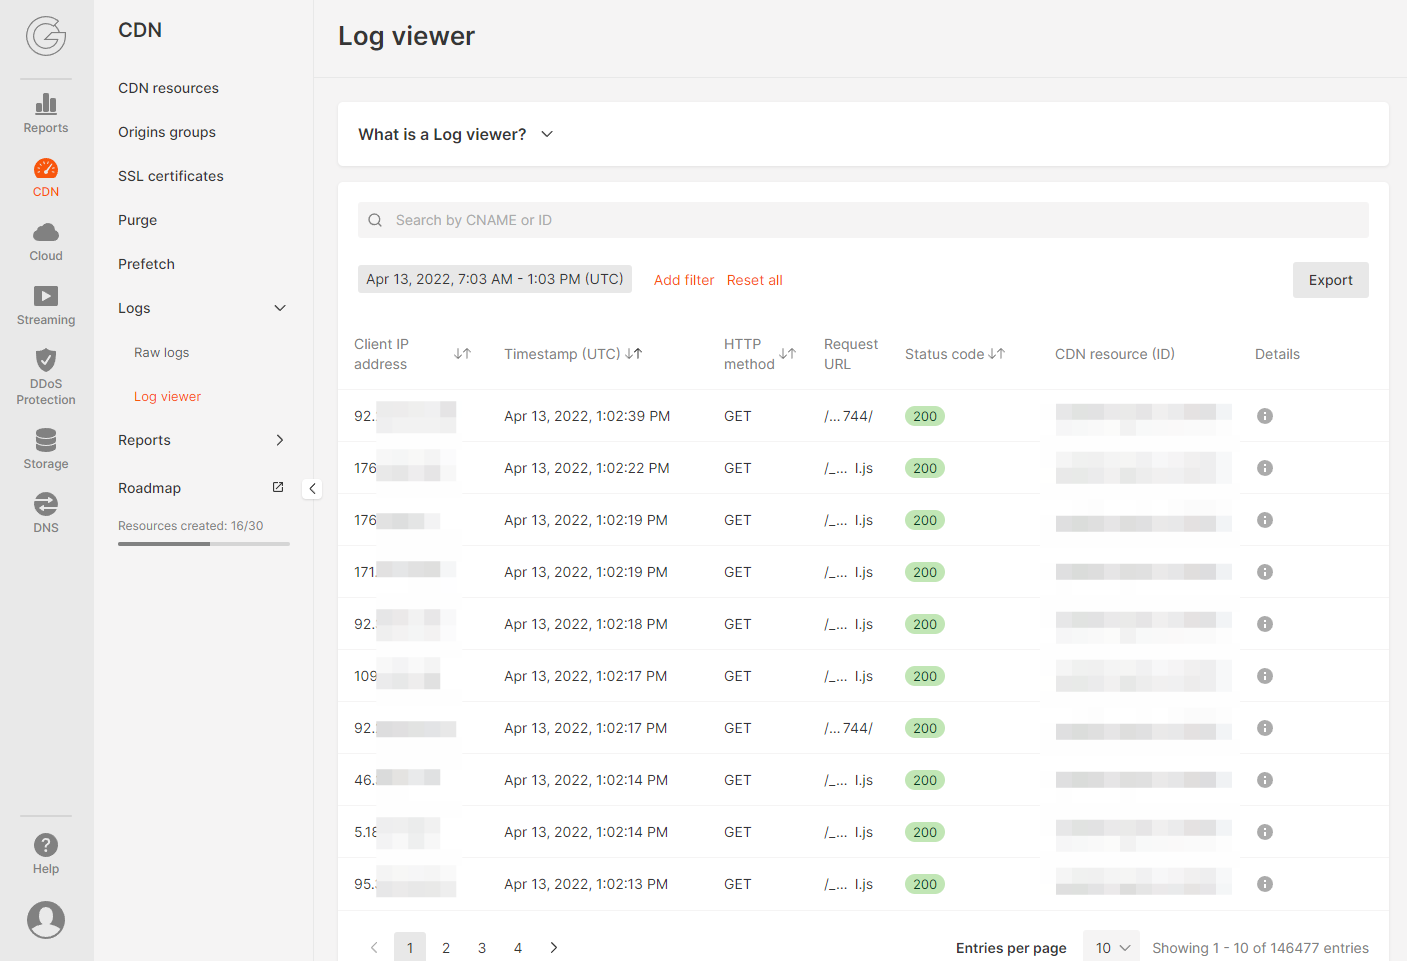
- To see logs of a specific CDN resource, enter its CNAME or ID.
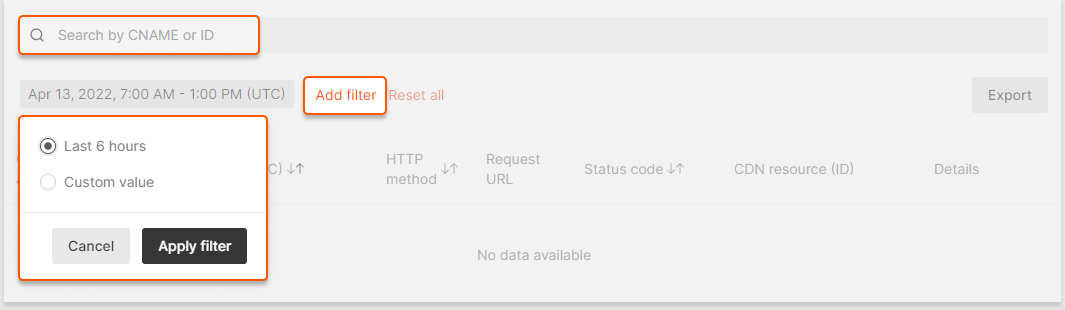
- To filter logs, click “Add filter” and set the required parameter: time, user’s IP address, HTTP method, status code, data center, or cache status.
- To see logs for another time interval, click the timestamp field and specify your values. You can choose any interval of up to 6 hours for any of the last 3 days.
- Client IP — an IP address of the client who sent the request.
- Timestamp — UTC time of the request.
- Method — an HTTP request method (GET, POST, DELETE, etc.).
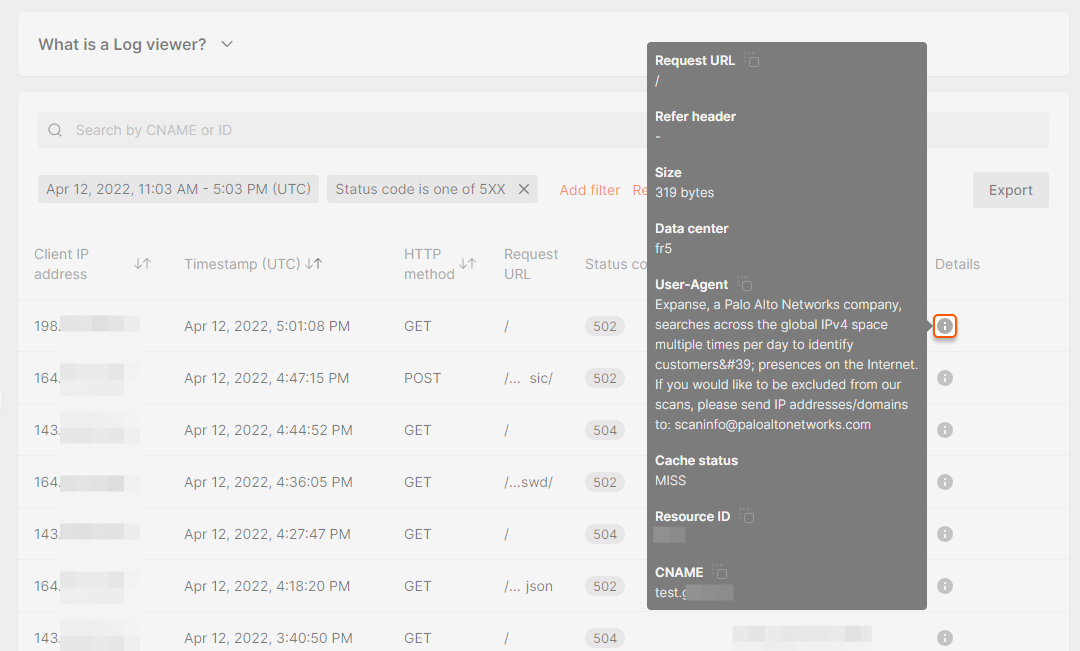
- Request URL — a URL of the requested page or file.
- Status code — a status of the response that was returned to the client.
- Refer header — a URL of the page from which the client opened the requested page. If it was a direct transition, the header will contain a dash.
- Size — the number of bytes in the response.
- Data center — a Gcore data center that received the client’s request.
- User-Agent — information about the client’s browser and operating system.
- Cache status — a source of the response: HIT means the response was sent from the CDN resource, MISS means the response was sent from the website.
- Resource ID — an ID of the requested CDN resource.
- CNAME — a CNAME of the requested CDN resource.
Export logs
Log Viewer allows you to download a file with logs collected for a maximum of 24 hours of CDN operation. One file can contain up to 10,000 log entries. If more logs have been collected in 24 hours, entries after the 10,000th will not be written to an export file. Logs are exported based on the filters that you have applied. To download logs to your PC: 1. Click the “Export” button on the right side of the page. 2. Select the time range of logs you want to download: you can keep the current period (selected in filters when viewing), or set a new value. 3. Choose the export format: CSV or TSV. 4. Click Export. The file will be downloaded to your browser download location.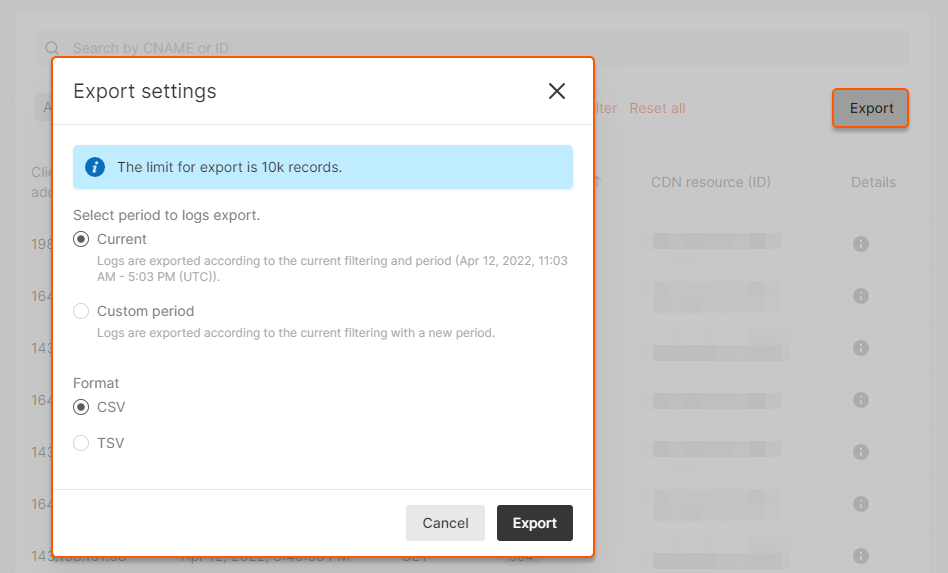
Manage Log Viewer via the API
You can also view and download logs via the API using requests from our API documentation. Below we explain how to create a request. 1. In a tool for working with an API, add an authorization header. Choose one of the two headers below, copy it, replace the expression in brackets with your data and remove the brackets.- Authorization: Bearer (yourstandard authorization token that is valid for 1 hour; its lifetime can be extended up to 24 hours)
- Authorization: APIKey (your permanent authorization token generated in your personal account; it never expires)
- A path to view —
https://api.gcore.com/cdn/advanced/v1/logs. - A path to export —
https://api.gcore.com/cdn/advanced/v1/logs/download.
| Parameter | Description | Example of parameter with value |
|---|---|---|
| from | Condition: this is a required parameter; a request will fail without it. It sets: the start of the time interval for which logs will be exported. How to specify: enter the time in ISO 8086 or RFC 3339 format. The time is indicated in UTC. | & from=2022-04-27T06 :00:00Z |
| to | Condition: this is a required parameter; a request will fail without it.It sets: the end of the time interval for which logs will be exported.How to specify: enter the time in the same format as in the “from” parameter. The interval between the “from” and “to” values should not exceed 6 hours for viewing and 24 hours for exporting. | & to=2022-04-27T12 :00:00Z |
| offset | It sets: skipping a certain number of logs from the beginning of the report.Default value: offset=0.How to specify: enter the number of entries you want to exclude from the report.Example: the report contains 100 entries, and you want to see only logs from 11 to 100. Set the “offset” value to 10: the first ten logs will be skipped, and you will see only entries from 11 to 100. | &offset=10 |
| limit | It sets: the number of entries in the report.Default value: 100 for viewing and 1000 for exporting.Maximum value: 1000 for viewing and 10,000 for exporting.How to specify: add the number of entries you want to see in the report.Example: if you set the “limit” value to 200, you will see the first 200 entries of the report.Specific case: together with the “offset” parameter, “limit” can be used to divide the report into segments of X logs. For example, you have 100 logs, but you need to split them into 10 lists of 10 entries each. To do this, use a combination of the “limit” and “offset” parameters. Send 10 requests with these combinations: &limit=10& offset=0& limit=20& offset=10& limit=30& offset=20…& limit=100& offset=90 | &limit=100 |
| fields | It sets: the fields that will be displayed in the report.Default value: if you do not set the “fields” parameter, you will see all available fields in the report — timestamp, path, method, referer, user_agent, client_ip, status, size, cname, resource_id, cache_status, datacenter, sent_http_content_type, tcpinfo_rtt.How to set: specify a comma-separated list of the fields that you want to see in the report. | &fields=method, status,size,path |
| field__op | It sets: filtering of logs in the report — only entries with a certain parameter value will be shown.You can apply filters for the following fields: method, client_ip, status, size, cname, resource_id, cache_status, datacenter.How to specify: replace “field” with the desired field. Use a double underscore after the field name to specify a filter operator: eq, gt, gte, lt, ne, in, not_in, contains (available operators for specific fields are specified in the API documentation). Place ”=” after the operator and specify the desired value. If you want to specify multiple filtering rules, add expressions to one line separated by ”&”.Example: if you set method__eq=GET, you will see only logs with the HTTP GET method in the report. | & status__gte=300& status__lt=400& method__in=GET, PUT |
| ordering | Condition: this parameter can be specified only for viewing.It sets: the order of entries in a report.Default value: if the “ordering” parameter is not set, the logs will be ordered by time — from earliest to latest.You can order entries in the following fields: method, client_ip, status, size, cname, resource_id, cache_status, datacenter, temestamp.How to set: specify the field by which you want to sort logs. Logs will be ordered from a smaller value to a larger one. For example, if you specify the “status” field, first you will see the entries with the response codes 2xx and ones with 5xx at last.If you need a reverse order, from larger to smaller, put ”-” in front of the field as follows: “-status”.You can also list multiple fields separated by commas. Then sorting will be consecutive: entries will be sorted first by the first field in the list; entries that have equal values in that field are then sorted by the value in the second field.Example: if you specify “ordering=status,size”, the entries will be first sorted by the response code: 200, 201, 202, 203… And if several logs have the same response code, they will be sorted by the second field — the size of the response in bytes. That is, for example, the list of several entries with the code 200 will start with the one with the smallest response size. | &ordering=size, -status |
| sort | Condition: this parameter can be specified only for export.It sets: the order of entries in a report.Default value: if the “ordering” parameter is not set, the logs will be ordered by time — from earliest to latest.You can order entries in the following fields: method, client_ip, status, size, cname, resource_id, cache_status, datacenter, temestamp.How to set: specify the field by which you want to sort logs. Logs will be ordered from a smaller value to a larger one. For example, if you specify the “status” field, first you will see the entries with the response codes 2xx and ones with 5xx at last.If you need a reverse order, from larger to smaller, put ”-” in front of the field: “-status”.You can also list multiple fields separated by commas.Then sorting will be consecutive: entries will be sorted first by the first field in the list; entries that have equal values in that field are then sorted by the value in the second field.Example: if you specify “ordering=status,size”, the entries will be first sorted by the response code: 200, 201, 202, 203… And if several logs have the same response code, they will be sorted by the second field — the size of the response in bytes. That is, for example, the list of several entries with the code 200 will start with the one with the smallest response size. | &sort=size, -status |
| format | Condition: this parameter can be specified only for export.It sets: the format the log report to be exported. Available formats are CSV and TSV.How to specify: enter “csv” or “tsv”. | &format=csv |
- Time range is from 6:00 to 12:00 (UTC) on April 27, 2022.
- The report should only contain the request method, the request path, the status of the response, the data center and the size of the request.
- We don’t need all the entries in the report; we only want to see logs about GET or POST requests whose responses were smaller than 100 bytes and had 3xx response codes.
https://api.gcore.com/cdn/advanced/v1/logs.
2. We specify the request method: “GET”.
3. We add the “Authorization” header and its value. We want to log in with a permanent token, so we specify our token “APIKey 7711$eyJ0eXAiOiJKV”.
4. We enter the request parameters: